4.2. Side menu and main table
4.2.2. Main report body
The main tables in the report organize variants in multiple tabs that correspond to specific analytic purpose.
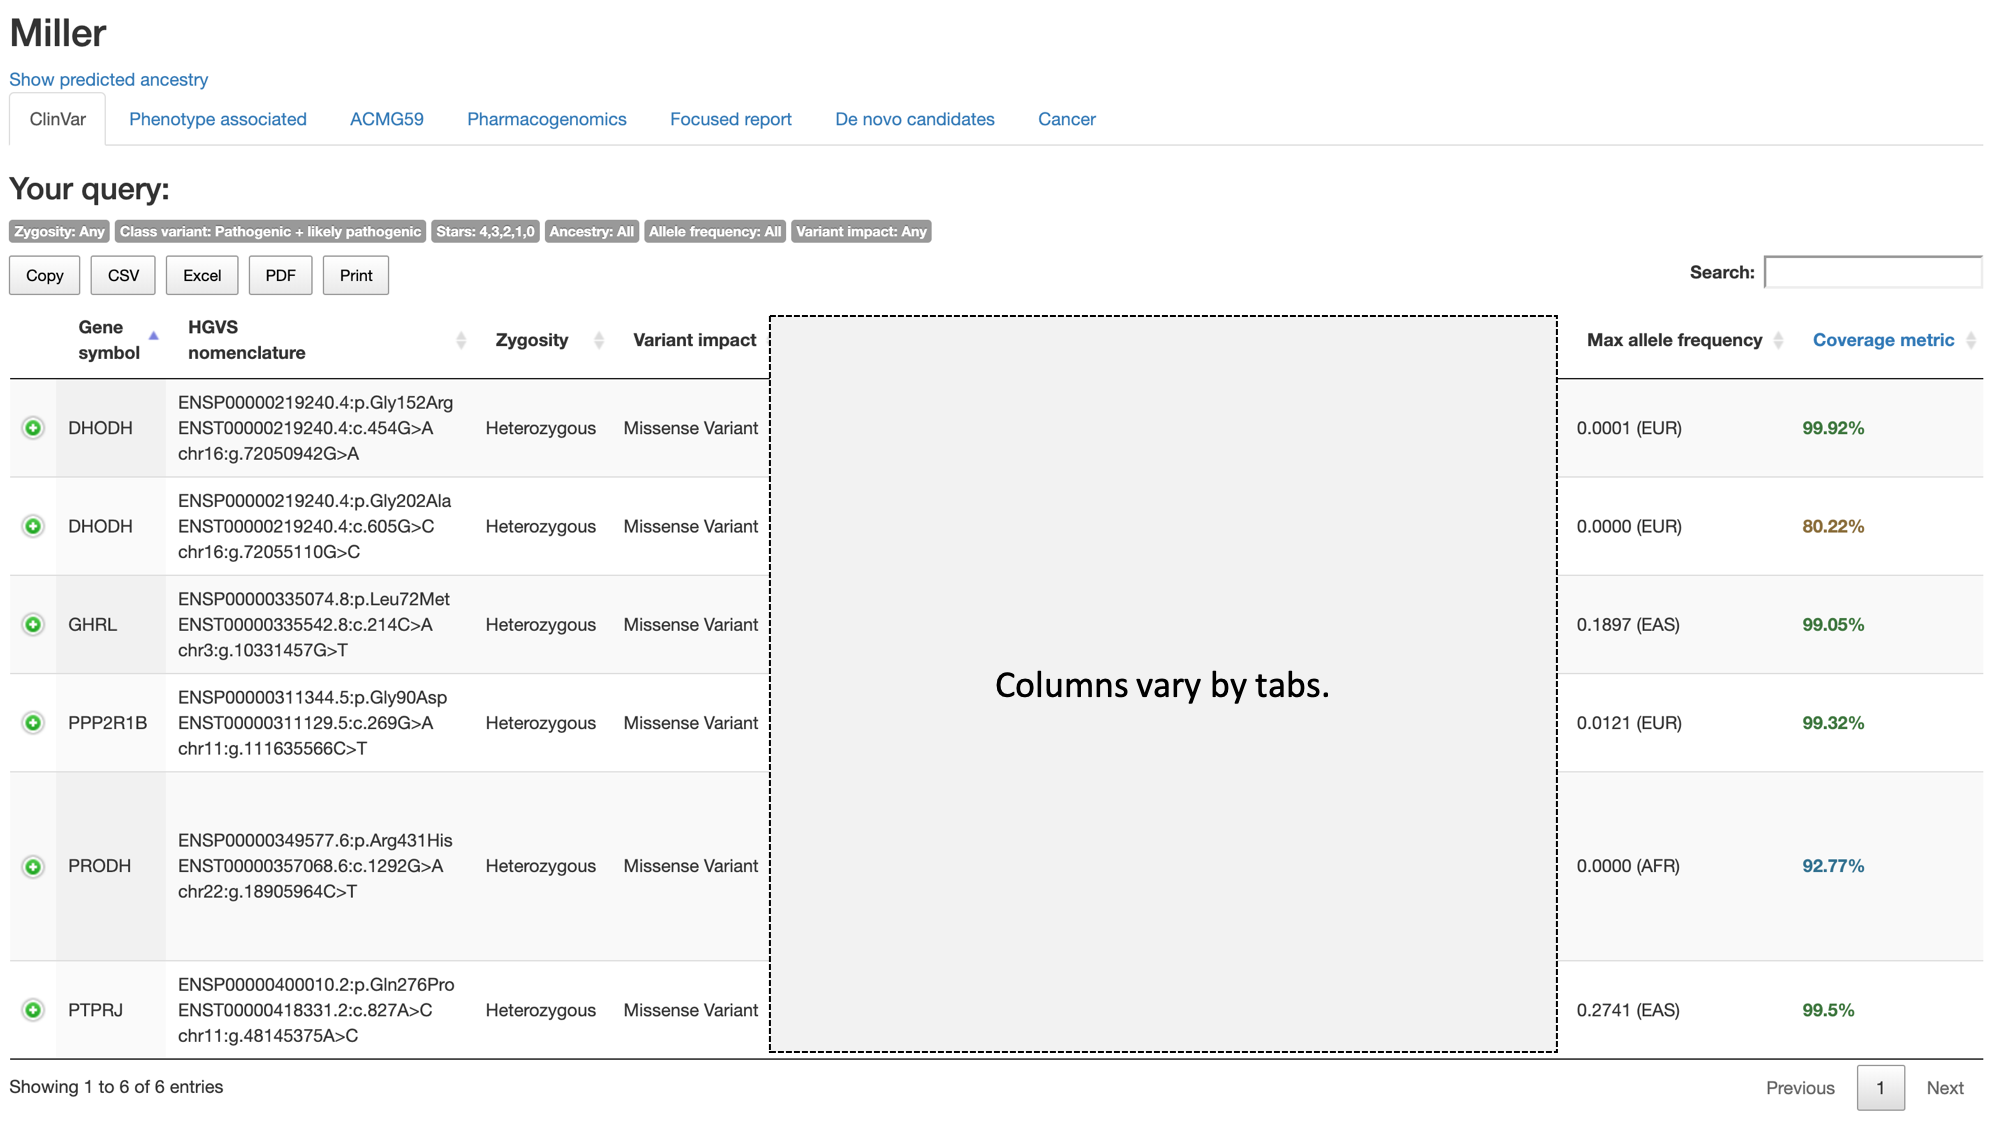
Under the name (identifier) of the current sample (Miller) and links to open ancestry prediction, tabs corresponding to report sections accessible to the current user are listed.
The small gray labels under the tag Your query: shows the values used to generate current report (tab), to remind users of the current setting and help to change settings for subsequent analysis.
In the above example, the Zygosity is set to Any, Pathogenicity (specific to ClinVar tab) is set to both Pathogenic and likely pathogenic, All is used for Ancestry, All is used for Allele frequency, and Any for Calculated variant consequences (Variant impact in the label).
The buttons Copy, CSV, Excel, PDF, and Print provide various options to save or export variants in current tab.
Using the Search box on the top right, users can quickly search for variants. Any text or value in the table can be searched here.
Columns common to tables in all tabs are as follows:
Gene symbol: The official symbol for the gene by HUGO Gene Nomenclature Committee (HGNC).HGVS nomenclature: The variant representation as recommended by the Human Genome Variation Society (HGVS). The latest recommendation can be found in this link.Zygosity: Zygosity of the variant.Variant impact: The Sequence Ontology (SO) terms describing the calculated consequence of the variant by VEP.Max allele frequency: The variant allele frequence of the variant allele from Genome Aggregation Database (gnomAD), release 2.0.2. The value in this column is allele frequency from exomes in gnomAD, and always shows the maximum value from 5 population groups in gnomAD (AFR: African, EAS: East Asian, SAS: South Asian, AMR: Latino, EUR: non-Finnish European (NFE in gnomAD)). The population group of the maximum value is also shown in parentheses. IfAncestryis specified, the allele frequencies of the specified population will be shown (under the column headingAllele frequency).Coverage metric: The percentage of gnomAD exomes with minimum of 20x read depth on the variant’s locus. The coverage values are graded by 4 different colors: green (99% or more exomes with 20x), blue (90% or more), brown (50% or more), and red (less than 50%).
The green plus sign left to the Gene symbol for each variant opens a hidden row containing links to more details on variants and to external sources.
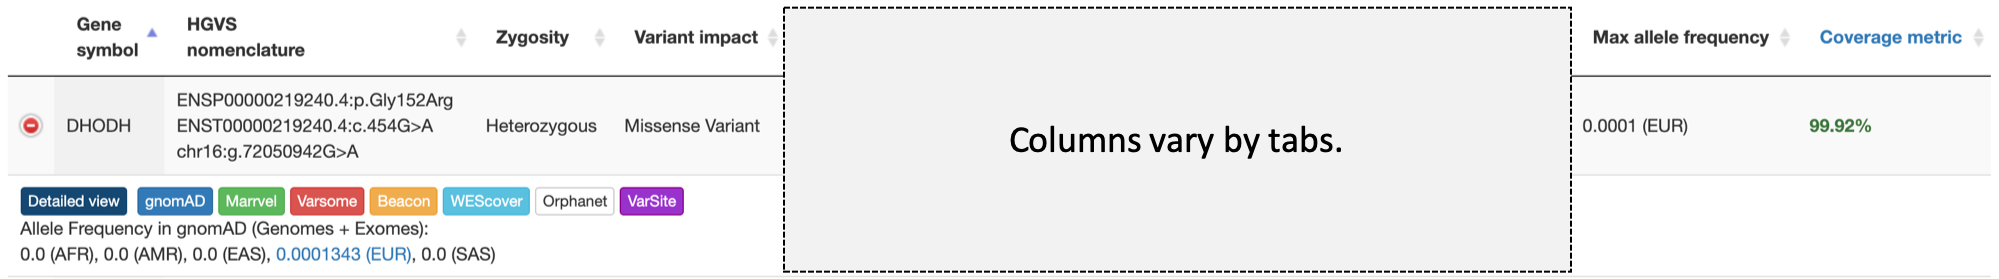
The links in the hidden row are:
Detailed view: Opens a separate window to show various detailed information about the variant.gnomAD: Links to a variant page in gnomAD, showing detailed allele frequencies and coverages.Marrvel: Links to Marrvel, a web application to prioritize human variants for rare diseases. It features ortholog search across model organisms including alignment of protein domains in ortholog proteins.Varsome: Links to Varsom, a community-based application of variant interpretation. It provides a variety of genetic and clinically relevant information for the variant.Beacon: Links to GA4GH Beacon Network, a search engine of genetic variants across various institutes and organizations.WEScover: Links to WEScover to investigate breadth of coverage of a gene over exomes in 1000 Genomes Project. In contrast toCoverage metricthat provides locus-specific value, it provides a gene-centric value.- (Restricted)
Orphanet: Opens a new window with lists of phenotypes associated to the gene. VarSite: Links to residue report for the variant by VarSite. VarSite features potential effects of the variant on protein 3D structure.
Also, the hidden row shows variant allele frequency in gnomAD exomes for each of 5 population groups (AFR, AMR, EAS, EUR (NFE), and SAS).
Besides the above common columns, the main table may contain additional columns depending on the current tab. The additional columns specific to each tab will be explained in subsections for the tab.
4.2.3. Variant details
Each row on the main table only shows the essential information as well as the calculated consequence of most severity.
However, the calculated consequence of a variant can change depending on the transcript used for prediction
Also, more information on the variant such as the predicted pathogenicity score, allele frequencies in multiple population-scale data, or protein families or domains affected by the variant can be very useful to interpret the variant.
The Detailed view on the main table opens a new window containing the following information.
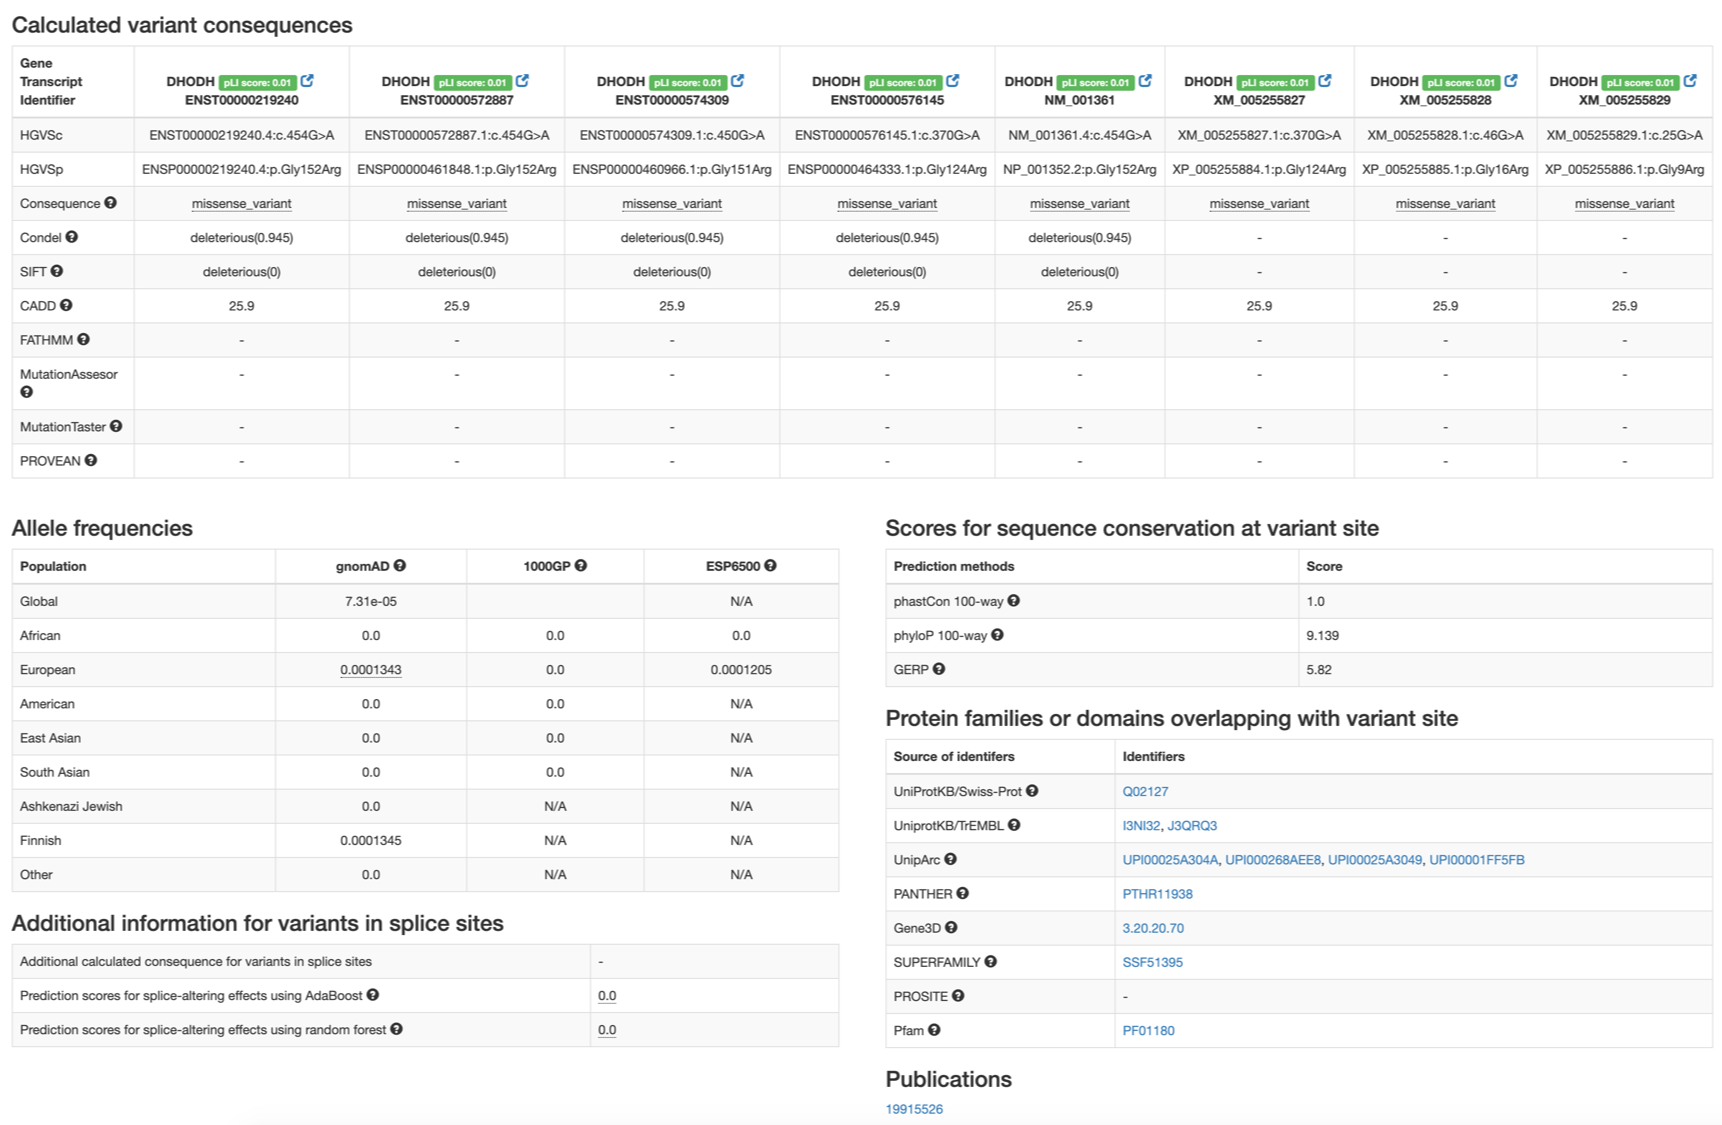
Calculated variant consequences: variant consequences predicted with VEP and pathogenicity scores calculated by multiple methods are organized by each gene or transcript on the variant’s location.- Includes a score of gene’s tolerance to loss-of-function variant (ExACpLI score `Re>`_).
- For each transcript, the representation of variant for cNDA or protein is shown.
- Pathogenicity scores calculated by Condel, SIFT, CADD, FATHMM, MutationAssessor <http://mutationassessor.org/>, MutationTaster, and PROVEAN.
Allele frequencies: variant allele frequencies from 3 population-scale data (gnomAD, 1000 Genomes Project, and the NHLBI Exome Sequencing Project).- Allele frequencies are calculated per each population group.
Additional information for variants in splice sites: prediction scores for splicing-altering effects for variants in splice sites.Scores for sequence conservation at variant site: scores for sequence conservation from multiple sequence alignment of various species. Scores from `phastCon <>`_, `phyloP <>`_, and `GERP <>`_ are provided.Protein families or domains overlapping with variant site: lists protein or protein domain identifiers that overlaps with variant’s position.Publications: list of PubMed identifiers for publications that cite the variant.